Intro to GlucoPy#
Using GlucoPy is simple. The first step is to import the package.
import glucopy as gp
Then, you need to import CGM data.
Importing data#
Using the
read_csv()function:
gf = gp.read_csv('path_to_file.csv')
Using the
read_excel()function:
gf = gp.read_excel('path_to_file.xlsx')
Using a
pandas.DataFrame:
import pandas as pd
df = pd.read_csv('path_to_file.csv')
gf = gp.Gframe(df)
If you have no CGM dataset, you can still try this toolbox using the sample data provided with the package in the
data()function
gf = gp.data()
All the previous functions return an instance of Gframe which is the main object of the package. This object
contains the CGM data and provides a set of methods to manipulate and analyze it.
Calculating metrics#
Basic metrics#
The Gframe object provides a set of methods to calculate metrics from the CGM data. For example, simple metrics like
the mean, standard deviation, and coefficient of variation can be calculated using like this:
In [1]: import glucopy as gp

In [2]: gf = gp.data()

In [3]: mean = gf.mean()

In [4]: std = gf.std()

In [5]: cv = gf.cv()

In [6]: mean, std, cv
Out[6]: (144.28068149003755, 64.72869948664865, 0.44863039748753963)
Calculating metrics for each day#
Most of the methods provided by Gframe can be calculated for each day of the dataset. For example, to calculate the
mean for each day:
In [7]: day_means = gf.mean(per_day=True)

In [8]: day_means
Out[8]:
Day
2020-11-27    277.636364
2020-11-28    138.677083
2020-11-29    146.552083
2020-11-30    120.052083
2020-12-01    139.229167
                 ...
2021-03-14    146.645161
2021-03-15    126.593407
2021-03-16    161.957895
2021-03-17    113.833333
2021-03-18    170.000000
Name: Mean, Length: 112, dtype: float64
And since the returned value when per_day is set to True is a pandas.Series, you can use any method provided
by the pandas.Series object. For example, to calculate the max of the means:
In [9]: day_means.max()
Out[9]: 277.6363636363636
You can alos access the mean of a specific day using the index of the pandas.Series:
In [10]: day_means["2020-12-01"]
Out[10]: 139.22916666666666
Glycaemia specific metrics#
Gframe also provides methods to calculate metrics specific to glycaemia. For example, to calculate the
Time in Range (TIR) for a given range:
In [11]: tir = gf.tir() # default range is [70, 180]

In [12]: tir
Out[12]:
ranges
(0.0, 70.0]       11.24
(70.0, 180.0]     61.04
(180.0, 445.0]    27.72
Name: Time in Range, dtype: float64
Calculating the Mean of Daily Differences (MODD)
In [13]: modd = gf.modd()

In [14]: modd
Out[14]: 69.06133828996282
Calculating the Glucose Variability Percentage (GVP)
In [15]: gvp = gf.gvp()

In [16]: gvp
Out[16]: 33.76052564549197
You can check the documentation of Gframe to see the full list of methods provided.
Summary#
You can also calculate a summary of the dataset using the Gframe.summary() method:
In [17]: summary = gf.summary()

In [18]: summary
Out[18]:
                                Metric        Value
0                                 Mean       144.28
1                   Standard Deviation        64.73
2             Coefficient of Variation         0.45
3                                  IQR        95.00
4                                 MODD        69.06
5              % Time below 70 [mg/dL]        11.24
6   % Time in between (70,180] [mg/dL]        61.04
7             % Time above 180 [mg/dL]        27.72
8                                  AUC  23075053.50
9                                 MAGE       121.68
10                   Distance Traveled    115800.00
11                                LBGI         5.74
12                                HBGI        13.51
13                                ADRR       101.97
14               GRADE Hypoglycaemia %        16.00
15                 GRADE Euglycaemia %         8.05
16              GRADE Hyperglycaemia %        75.95
17                             Q-Score        13.89
18                               CONGA        45.72
19                                 GVP        33.76
20                                 MAG        43.56
21                                 DFA         0.85
22                              SampEn         0.63
23                                 MSE         1.26
Plotting#
GlucoPy uses Plotly to create interactive plots. The module Plot provides a set of functions to create different
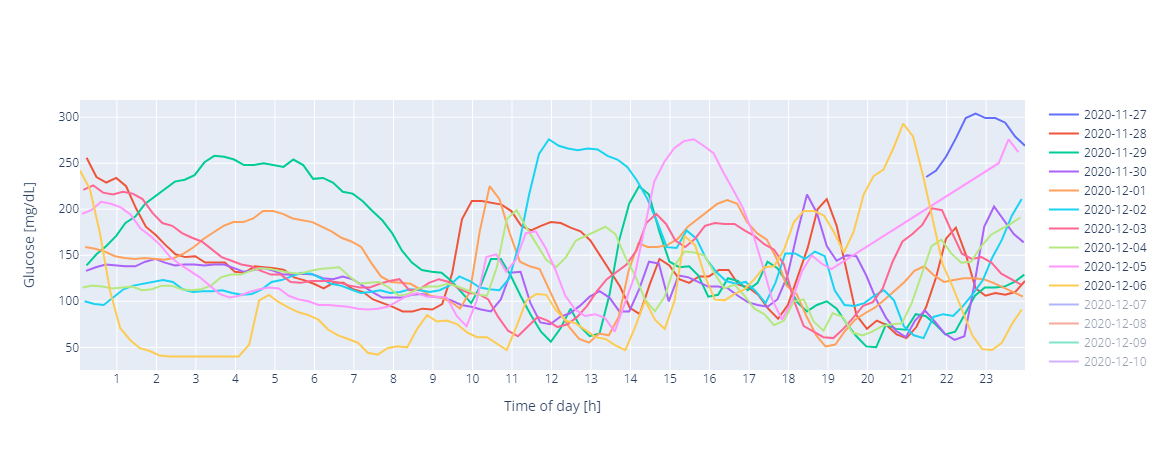
types of plots. For example, to create a plot of the CGM data:
In [19]: gp.plot.per_day(gf,num_days=7)
Out[19]:
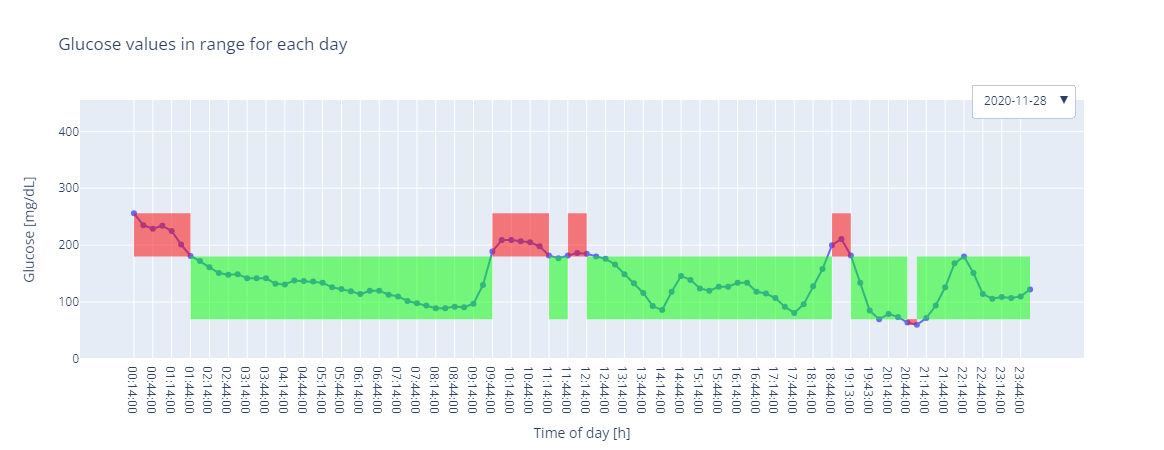
Or a plot that highlighs the TIR:
In [20]: gp.plot.tir(gf)
Out[20]: