glucopy.Gframe.dfa#
- Gframe.dfa(per_day: bool = False, scale='default', overlap: bool = True, integrate: bool = True, order: int = 1, show: bool = False, **kwargs)[source]#
Calculates the Detrended Fluctuation Analysis (DFA) using neurokit2.fractal_dfa().
For more information on the parameters and details see
neurokit2.complexity.fractal_dfa().- Parameters:
per_day (bool, default False) – If True, returns a
pandas.Serieswith the DFA for each day. If False, returns the DFA for the entire dataset. If a day has very few data points, the DFA for that day will be NaN.others – For more information on the rest of the parameters see
neurokit2.complexity.fractal_dfa().
- Returns:
dfa – Detrended fluctuation analysis.
- Return type:
float | pandas.Series
Examples
Calculating the DFA for the entire dataset:
In [1]: import glucopy as gp

In [2]: gf = gp.data('prueba_1')

In [3]: gf.dfa()
Out[3]: 0.8517129383011254
Calculating the DFA for each day:
In [4]: gf.dfa(per_day=True)
Out[4]:
Day
2020-11-27         NaN
2020-11-28    0.513122
2020-11-29    1.529264
2020-11-30    2.705757
2020-12-01    1.592972
                ...
2021-03-14    1.738474
2021-03-15    1.732668
2021-03-16    1.401262
2021-03-17    2.133959
2021-03-18    1.369435
Name: DFA, Length: 112, dtype: float64
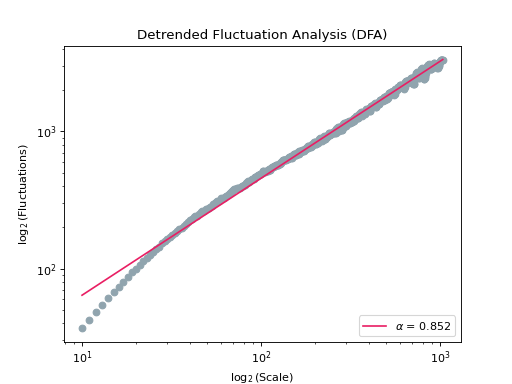
Calculating and showing the DFA for the entire dataset:
In [5]: gf.dfa(show=True)
Out[5]: 0.8517129383011254