glucopy.plot.agp#
- glucopy.plot.agp(gf: Gframe, add_quartiles: bool = True, add_deciles: bool = True, e: float = 1.0, height: float = None, width: float = None)[source]#
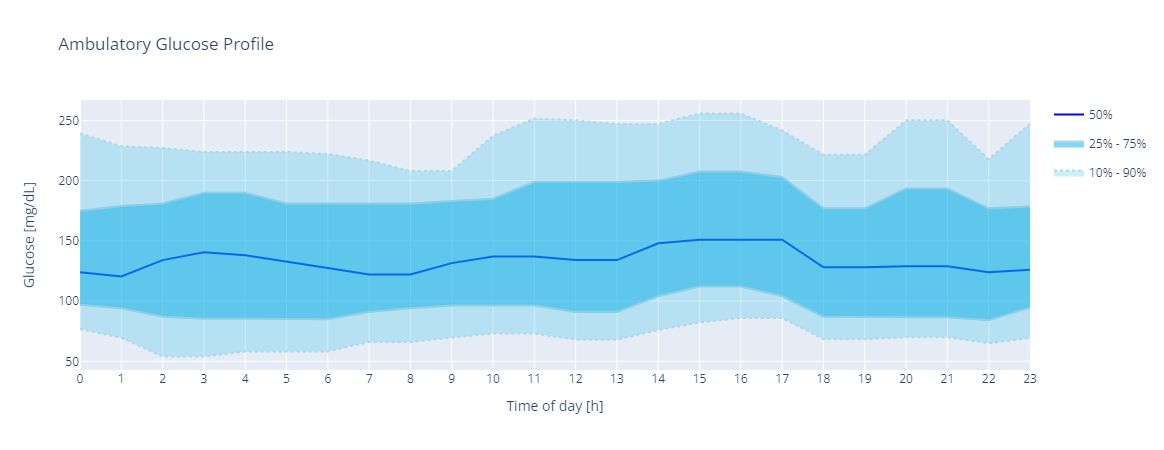
Plots an Ambulatory Glucose Profile plot of the CGM values in the Gframe object.
The Procedure is as follows:
The data is grouped by hour
The 10th, 25th, 50th, 75th and 90th percentiles are calculated for each hour
A process of smoothing is applied to the 5 series of percentiles. The process is as follows:
\[\widetilde X_q(i) = median[ u(i), v(i), w(i) ]\]\(u(i) = median[ X_q(i-1), \frac{3*X_q(i-1)-X_q(i-2)}{2}, X_q(i) ]\)
\(v(i) = median[ X_q(i-1), X_q(i), X_q(i+1) ]\)
\(w(i) = median[ X_q(i+1), \frac{3*X_q(i+1)-X_q(i+2)}{2}, X_q(i) ]\)
\(\widetilde X_q(i)\) is the smoothed glucose concentration at time \(i\) and percentile \(q\)
\(X_q(i)\) is the glucose concentration at time \(i\) and percentile \(q\)
- Parameters:
gf (Gframe) – Gframe object to plot
add_quartiles (bool, default True) – If True, the quartiles (25%, 75%) of the data will be added to the plot
add_deciles (bool, default True) – If True, the deciles (10%, 90%) of the data will be added to the plot
e (non negative float, default 1.0) – Tolerance for negligible change
height (float, default None) – Height of the plot
width (float, default None) – Width of the plot
- Returns:
fig – Figure object
- Return type:
Examples
Plot the Ambulatory Glucose Profile
In [1]: import glucopy as gp

In [2]: gf = gp.data()

In [3]: gp.plot.agp(gf)
Out[3]: