glucopy.Gframe.mse#
- Gframe.mse(per_day: bool = False, scale='default', dimension=3, tolerance='sd', method='MSEn', show=False, **kwargs)[source]#
Calculates the Multiscale Sample Entropy using neurokit2.entropy_multiscale()
For more information on the parameters and details see
neurokit2.complexity.entropy_multiscale().- Parameters:
per_day (bool, default False) – If True, returns a
pandas.Serieswith the Multiscale Sample Entropy for each day. If False, returns the Multiscale Sample Entropy for the entire dataset.others – For more information on the rest of the parameters see
neurokit2.complexity.entropy_multiscale().
- Returns:
mse – Multiscale Sample Entropy.
- Return type:
float | pandas.Series
Examples
Calculating the Multiscale Sample Entropy for the entire dataset:
In [1]: import glucopy as gp

In [2]: gf = gp.data('prueba_1')

In [3]: gf.mse()
Out[3]: 1.2628694577099027
Calculating the Multiscale Sample Entropy for each day:
In [4]: gf.mse(per_day=True)
Out[4]:
Day
2020-11-27         NaN
2020-11-28    0.374240
2020-11-29    0.512896
2020-11-30    0.357736
2020-12-01    0.269845
                ...
2021-03-14    0.287104
2021-03-15    0.691363
2021-03-16    0.291513
2021-03-17    0.360221
2021-03-18    0.461315
Name: MSE, Length: 112, dtype: float64
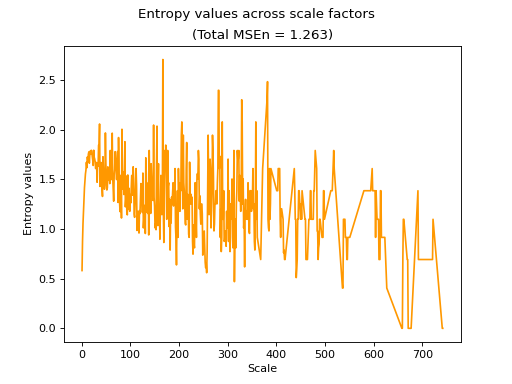
Calculating and showing the Multiscale Sample Entropy for the entire dataset:
In [5]: gf.mse(show=True)
Out[5]: 1.2628694577099027