glucopy.plot.per_day#
- glucopy.plot.per_day(gf: Gframe, num_days: int = 0, height: float = None, width: float = None)[source]#
Plots a line plot of the CGM values for each day in the Gframe object
- Parameters:
gf (Gframe) – Gframe object to plot
num_days (int, default 0) – Number of days to plot, if 0 all days are plotted. The days that are not plotted can still be shown by clicking on the legend
height (float, default None) – Height of the plot
width (float, default None) – Width of the plot
- Returns:
fig – Figure object
- Return type:
Examples
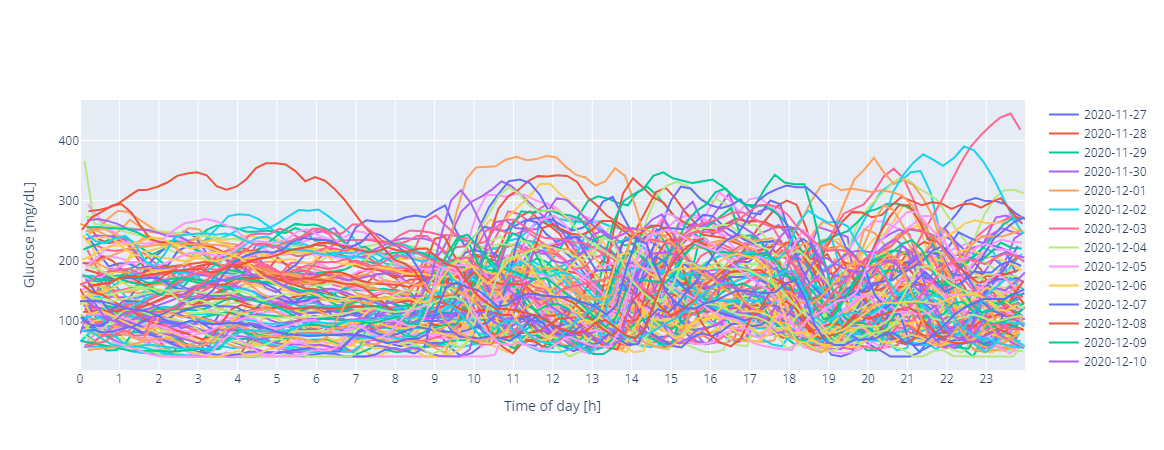
Plot all days in the Gframe object
In [1]: import glucopy as gp

In [2]: gf = gp.data()

In [3]: gp.plot.per_day(gf)
Out[3]:
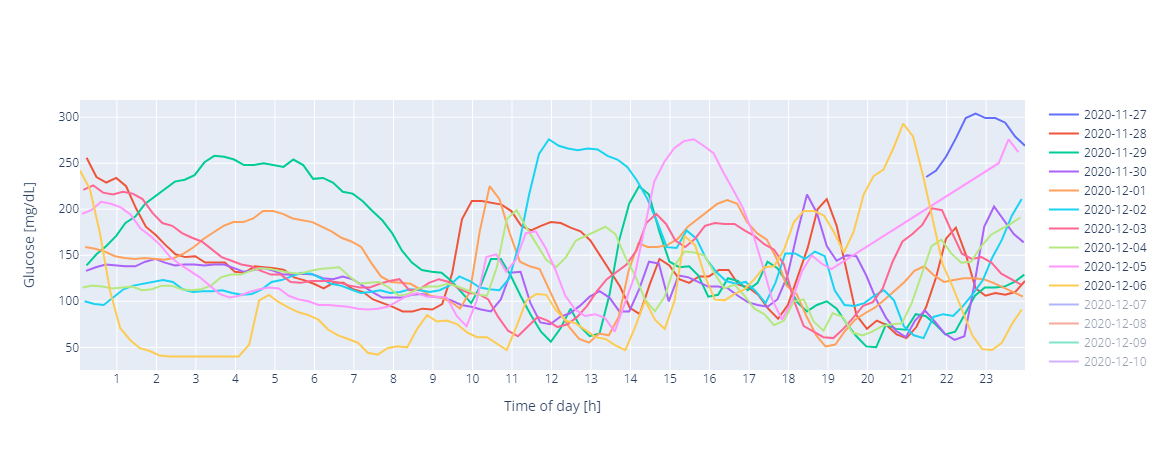
Plot only the first 10 days in the Gframe object (the rest of the days still can be shown by clicking on the legend)
In [4]: gp.plot.per_day(gf, num_days=10)
Out[4]: