glucopy.plot.box#
- glucopy.plot.box(gf: Gframe, per_day: bool = True, group_by_week: bool = False, height: float = None, width: float = None, points: str = None)[source]#
Plots a box plot of the CGM values in the Gframe object
- Parameters:
gf (Gframe) – Gframe object to plot
per_day (bool, default True) – If True, the plot will be separated by days. If the Gframe contains a lot of days, it is and per_day is True, it is recommended to set group_by_week to True
group_by_week (bool, default False) – If True, the plot will be grouped by week. Only works if per_day is True
height (float, default None) – Height of the plot
width (float, defualt None) – Width of the plot
points (str, default None) – Show points in the plot, can be ‘all’, ‘outliers’, ‘suspectedoutliers’, False
- Returns:
fig – Figure object
- Return type:
Examples
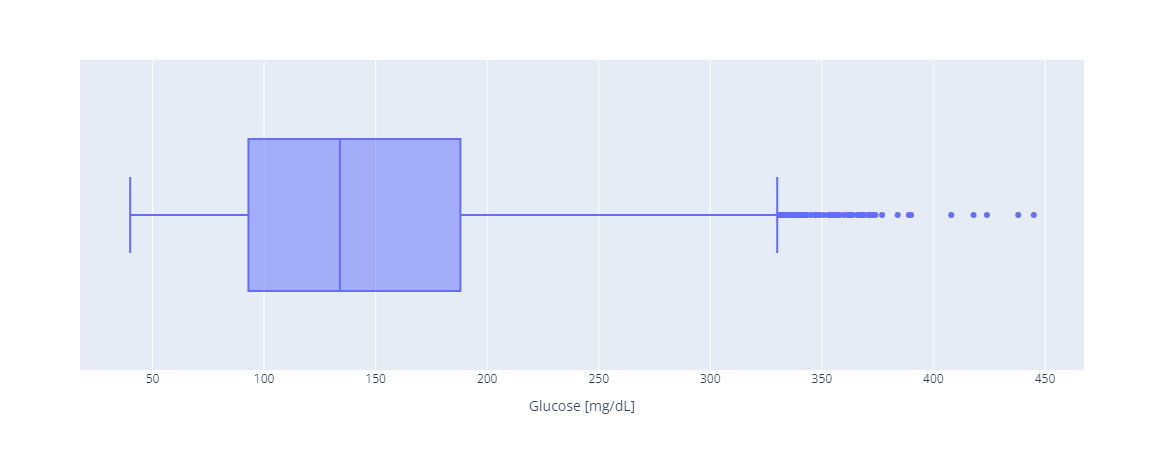
Plot a box plot of the entire dataset
In [1]: import glucopy as gp

In [2]: gf = gp.data('prueba_1')

In [3]: gp.plot.box(gf, per_day=False)
Out[3]:
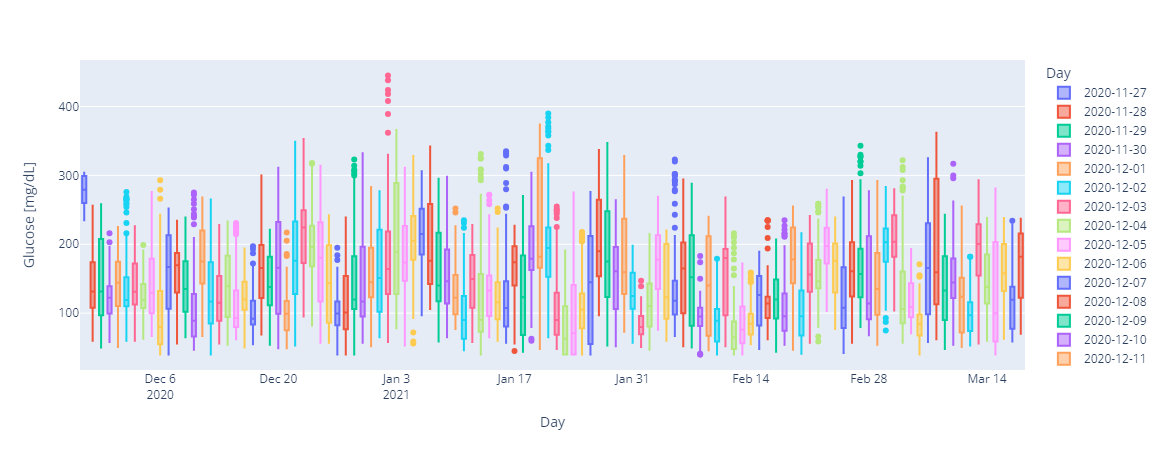
Plot a box plot per day
In [4]: gp.plot.box(gf, per_day=True)
Out[4]:
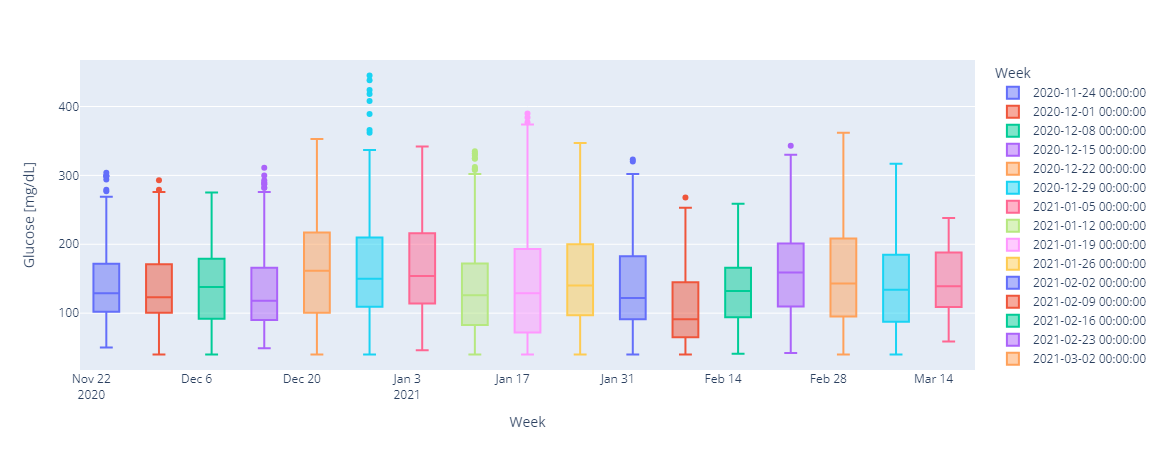
Plot a box plot per day, grouped by week
In [5]: gp.plot.box(gf, per_day=True, group_by_week=True)
Out[5]: